I’ve spent years studying how urban spaces adapt to new mobility solutions, and one question I get asked constantly is: how should cities decide between promoting cargo e-bikes and small electric vans for last-mile logistics? It’s not an either/or choice in many places, but getting the balance right can transform congestion, emissions, delivery speed and street life. Below I share the metrics I believe cities should use to make informed, context-sensitive decisions—grounded in evidence, but also in the everyday realities of streets and couriers.
Why metrics matter (and what the decision really involves)
When a city debates whether to incentivize cargo e-bikes or small electric vans (EVs), it’s tempting to reduce the decision to headlines: “bikes = sustainable, vans = polluting.” The truth is more nuanced. The right mode depends on delivery density, urban form, curbspace availability, cost structures, safety, and even local climate. Metrics help translate those factors into actionable policy: fleet procurement incentives, parking regulations, loading zone allocation, and street design.
Core metrics every city should track
Below are the foundational metrics I use to evaluate which mode makes sense in a given context. These are operational, economic, environmental and social measures that can be collected from operators, sensors, pilot programs and surveys.
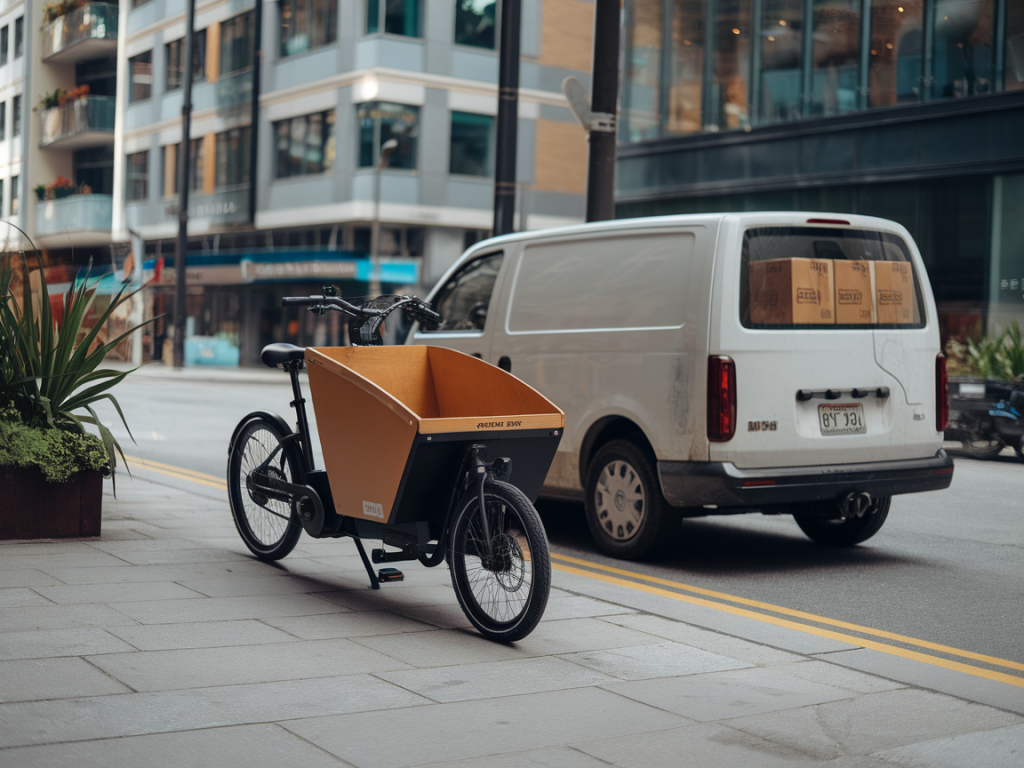
Delivery density (drops per km² per day) — How many deliveries are needed within a specific area. High-density urban cores often favor cargo e-bikes because they can handle many short stops efficiently.Parcel size and weight distribution — Percentage of parcels under 20 kg (suitable for e-bikes) versus heavier loads that require vans. Grocery and small parcels typically fit e-bike profiles.Average route length and trip patterns (km per tour) — Longer suburban routes with dispersed stops may favor small electric vans due to range and cargo volume.Average stops per tour and dwell time — Frequent short stops reduce van efficiency; e-bikes excel at quick in-street stops and accessing restricted areas.Vehicle km travelled (VKT) and emissions per parcel — Compare lifecycle emissions and operational energy use: emissions per parcel delivered gives a fair environmental comparison.Cost per parcel delivered — Includes vehicle acquisition or leasing, maintenance, energy, parking fines, and labor. E-bikes have lower capital and energy costs but may require more couriers for equivalent volume.Curbspace and loading zone utilization — How much curb space each mode requires and the turnover rate. E-bikes can use tighter spaces, reducing the need for large loading bays.Safety incidents per 100,000 km — Track collisions and near-misses. Vulnerable road user safety and interaction with pedestrians/cyclists matters greatly in dense areas.Speed and reliability (on-time delivery rate) — Measure actual delivery times and adherence to promised windows. Congested streets can flip the efficiency calculus.Accessibility to restricted zones — Low-emission zones, pedestrianized streets, and narrow alleys might be accessible only to bikes or require special permits for vans.Noise impact (dB at curb) — Night deliveries in residential areas often need low-noise solutions; e-bikes are typically quieter than vans.Labor implications: courier capacity and working conditions — How many trips a courier can complete per shift, physical strain, and safety affect employment practices and social equity.How to measure these metrics in practice
Collecting data doesn’t have to be intrusive. I recommend a mix of methods:
Operator telemetry — GPS, odometer, and sensor data from e-bike and EV fleets provide VKT, route length and stop patterns.Parcel-level logs — Integrate delivery management platforms to aggregate parcel weights, dimensions and timestamps.On-street audits — Manual observation or camera-based analytics to measure curb usage, dwell times and conflict points.Pilot programs — Time-boxed trials with KPIs: emissions per parcel, cost per parcel, and satisfaction scores from couriers and recipients.Surveys and interviews — Qualitative insights from couriers, retailers, and residents often reveal operational frictions not visible in telemetry.Comparative table: quick reference for city planners
| Metric | Cargo e-bikes | Small electric vans |
| Best urban context | Dense city cores, pedestrian zones, narrow streets | Suburban areas, longer routes, larger-volume deliveries |
| Typical parcel size | Small to medium (<20–50 kg depending on model) | Medium to large |
| Energy per parcel | Low | Higher (but low tailpipe emissions if EV) |
| Curbspace required | Minimal | Significant (parking/loading bays) |
| Noise | Low | Moderate (EVs quieter than ICE) |
| Cost (CapEx/OpEx) | Lower | Higher |
| Safety risk to riders | Higher for couriers (exposure), lower to others | Lower for drivers, higher risk to pedestrians in collisions |
| Accessibility to restricted zones | High | Variable (permits required) |
Putting metrics into policy: examples of actionable thresholds
From my work, the following thresholds can help turn data into policy decisions or procurement rules:
Deliveries per hectare per day > 150: Prioritize cargo e-bikes for last-mile consolidation hubs and micro-depots.Average parcel weight > 30 kg in > 30% of deliveries: Reserve small electric vans for those routes or enable mixed-mode pickups.Average route length < 10 km and stops > 20: E-bikes often outperform vans on speed and cost-per-stop.Curb occupancy turnover < 3 minutes per stop needed: Designate micro-loading bays for e-bikes to maintain flow.Night delivery windows in residential zones: Favor e-bikes for low-noise operations, or schedule van deliveries to daytime only.Operational strategies that blend both modes
In most cities, the best outcome is a hybrid approach. Here are practical strategies I’ve seen work:
Micro-depots + feeder vans: Use small electric vans to bring consolidated loads to micro-depots at the edge of dense zones; distribute last-mile parcels via cargo e-bikes.Dynamic allocation: Implement software that allocates parcels to e-bikes or vans based on real-time weight, distance and curb availability—similar to what platforms like Stuart or Gnewt/Cocargo test in Europe.Incentivize mode shift using pricing: Lower licensing fees, priority loading times, or reduced congestion charges for e-bike operators in dense zones.Shared infrastructure: Provide charging and maintenance hubs for both e-bikes and small EVs at micro-depots to reduce deadheading and improve uptime.Metrics I always watch during pilots
When I run pilots or evaluate operator proposals, I pay special attention to:
Emissions per parcel (kg CO2e/parcel) — inclusive of electricity source, manufacturing amortization for vehicles, and deadhead trips.On-street conflict rates — near-miss reports and insurance claims per 10,000 km.Courier throughput and wellbeing — parcels per hour and attrition/sick-day rates; sustainable models keep couriers safe and economically viable.Resident complaints and satisfaction — noise, blocked sidewalks, and delivery reliability shape public acceptance.Choosing between cargo e-bikes and small electric vans is a systems problem, not a trivia question. By grounding decisions in robust, comparable metrics—and by piloting hybrid models with clear KPIs—cities can design logistics ecosystems that reduce emissions, free up curbspace, improve safety, and keep urban life moving. If you want, I can share a template KPI dashboard your city team can use to run a 3-month pilot and compare e-bike vs van performance side-by-side.